LARGE SCALE TRACK
CARLANG A 2025 PEA EXECUTIVE SUMMARY
- Strong Economics (based on long term price and exchange rate assumptions)
- $1.91 Billion Pre-Tax NPV(8%), 15% IRR
- $1.48 Billion After-Tax NPV(8%), 14% IRR
- Large Scale, Low Cost Project
- Average annual production of 83 million pounds of nickel, 615 million tonnes of iron and 36.7 million pounds of chrome and 31 thousand pounds of cobalt
- By-product credits associated with iron, chrome and cobalt
- Life of Mine C1 Cash Costs of US$4.36/lb Ni; Net AISC Costs of US$4.87/lb nickel net of by-product credits (based on long term price and exchange rate assumptions)
- 20 year mine life totalling 753,000 tonnes of nickel
- Low strip ratio of 0.38 reflective of thin overburden cover averaging 3 metres over the proposed open pit
- Robust Project Economics
- $681 Million of annual EBITDA
- $360 Million of annual Free Cash Flow over the 20 years of production
A PEA is preliminary in nature and includes inferred mineral resources that are considered too geologically speculative to have economic considerations applied that would allow them to be categorized as mineral reserves whereby there is no certainty that the results of the PEA will be realized.
Mineral Processing and Metallurgical Testing
Corem metallurgical laboratory was contracted by EV Nickel Inc. (EVNi) to perform sample characterization and bench-scale laboratory testwork on A zone material, with the objective of producing saleable nickel sulphide and magnetite (FeCr) concentrates. The lab flowsheet and conditions closely followed the results reported in the Canada Nickel Company (CNC) Crawford technical reports (Ausenco 2023). All results were included in a final report by Corem on the T3605 test program (Corem, 2025).
A total of 20 intervals were selected for metallurgical testing from 2022 drilling performed by EVNi. Of the 20 samples, 11 were included in the 2024 testwork program and only four were sent for quantitative mineralogical analysis. From the analysis of these samples, CarLang A zone mineralogy is highly variable in both nickel deportment as well as non-sulphide gangue that is independent of the consistent assays shown for Ni, Fe, S and MgO. While this also reported for the Crawford project, the quality of both nickel sulphide and magnetite (FeCr) concentrates may be at the lower end of the range expected from the Crawford process flowsheet. Continued metallurgical testing on A zone samples will better quantify this, as expected performance for Crawford material has improved following investigations performed at each of level of study.
Limited optimization work was done by Corem to improve on the initial test results for each of the 11 samples. Some adjustments were made to grind sizes and reagent additions (including the use of dispersants Calgon and carboxymethyl cellulose or CMC) and the number of cleaner flotation stages. In addition, earlier tests used Davis Tube Recovery (DTR) methods to represent magnetic separation stages. This was modified to include Wet Low Intensity Magnetic Separation (WLIMS) in later tests and resulted in higher % Fe values in the magnetite concentrate.
Based on the testwork completed by Corem on 11 samples from the CarLang A zone, recoveries to a nickel sulphide concentrate and magnetite (FeCr) concentrate were estimated. These estimates are preliminary but are suitable for the mine plan completed by SRK. Considering the highly variable nature of the A zone test samples and the lack of predictability in performance of the evaluated flowsheet, further metallurgical testwork is recommended.
Mining Methods
The CarLang A deposit is expected to be mined using conventional open pit mining methods using trucks and shovels. The life of mine (LOM) is 20 years at a mill feed rate of 43.3 million tonnes per annum (Mtpa) and a maximum total material movement of 72 Mtpa. The mine schedule includes one year of pre-production to generate waste fill for the tailings management facility (TMF). The primary equipment will be 34 m3 shovels and 229 t haul trucks.
The resource model was regularized to 20x20x15 m, which resulted in 1.7% dilution and 0.1% loss. No additional factors were applied to the tonnes and grades. Revenue factor (RF) 67% was selected from the pit optimization results as the basis of the pit design, which resulted in 840 Mt of plant feed at an average grade of 0.23% Ni with a strip ratio of 0.38.
Recovery Methods
The CarLang A mineralization will be processed through a single, on-site plant with a design capacity of 120 thousand tonnes per day (ktpd) or 43.8 Mtpa, producing saleable nickel sulphide and magnetite (FeCr) concentrates.
The plant flowsheet includes crushing, grinding, sulphide flotation and magnetic separation to generate the two concentrates. Nickel sulphide recovery is done in stages with both coarse and fine flotation following grinding and deslime removal. Both concentrates are thickened and filtered prior to storage before transport off-site. The plant is based on average head grades of 0.23% Ni and 5.3% Fe.
Preliminary recoveries have been estimated at 5% to 20% Ni to the sulphide concentrate and 55% Fe and 20% Ni to the magnetite concentrate. The sulphide concentrate is assumed to be 25% Ni and 0.17% Co as payables with 25% MgO and 27% SiO2 as potential penalty elements. The magnetite concentrate is assumed to be 48% Fe and 1% Cr as payables with 15% MgO, 12% SiO2 and 0.04% S as potential penalty elements.
Project Infrastructure
Environmental Studies, Permitting & Social or Community Impact
Capital & Operating Costs
The capital and operating costs have been estimated based on benchmarks of similar projects and based on first principles where possible. All costs are in Canadian dollars, unless specified. The costs have been estimated to a scoping level of accuracy.
The capital cost estimate is summarized in Table 1‑1.
Table 1‑1: Capital Cost Estimate Summary
| Item | Unit | Initial Capital | Sustaining Capital | Total Capital | |
| Mining1 | M$ | 56 | 207 | 263 | |
| Mill2 | M$ | 2,263 | - | 2,263 | |
| On-Site Infrastructure | M$ | 166 | 16 | 182 | |
| Tailings & Water Management | M$ | 228 | 1,100 | 1,329 | |
| Closure Costs | M$ | 11 | 164 | 175 | |
| Construction Indirects & Owner Costs | M$ | 425 | - | 425 | |
| Total Project Capital | M$ | 3,150 | 1,487 | 4,637 | |
1 Mine initial capital costs include capitalized pre-production operating costs.
2 Mill sustaining costs are included in the processing operating costs.
Source: SRK 2025
The operating cost estimate is summarized in Table 1‑2.
Table 1‑2: Operating Cost Estimate Summary
| Item | LOM Total (M$) | Unit Cost ($/t-milled) | Unit Cost ($/t-mined) |
| Mining1 | 3,231 | 3.85 | 2.85 |
| Processing2 | 5,726 | 6.82 | 6.82 |
| General & Administrative | 671 | 0.80 | 0.80 |
| Tailings Management | 208 | 0.23 | 0.23 |
| Total Site Operating Cost | 9,818 | 11.69 | 10.69 |
1 Mine operating costs exclude capitalized pre-production operating costs.
2 Processing operating costs include mill sustaining costs.
Source: SRK 2025
Economic Analysis
The key project metrics are summarized in Table 1‑3 and Table 1‑4.
Table 1‑3: Life of Mine Physicals
| Item | Units | Value |
| Physicals (Mill Feed) | ||
| Mill Feed | Mt | 840 |
| Ni Feed Grade | % | 0.23 |
| Co Feed Grade | % | 0.01 |
| Cr Feed Grade | % | 0.23 |
| Fe Feed Grade | % | 5.33 |
| S Feed Grade | % | 0.06 |
| MgO Feed Grade | % | 37.0 |
| S/Ni Feed Ratio | 0.25 | |
| Ni Concentrate | ||
| Ni Recovery | % | 14.6 |
| Co Recovery | % | 2.2 |
| Ni Concentrate Grade | % | 25.0 |
| Co Concentrate Grade | % | 0.17 |
| Ni Concentrate | Mt | 1,147 |
| FeCr Concentrate | ||
| Fe Recovery | % | 55.0 |
| Cr Recovery | % | 26.3 |
| Ni Recovery | % | 26.2 |
| Fe Concentrate Grade | % | 48.0 |
| Cr Concentrate Grade | % | 1.0 |
| Ni Concentrate Grade | % | 1.0 |
| FeCr Concentrate | Mt | 51,287 |
| Salable Metal Total Recovery | ||
| Ni Recovery | % | 40.8 |
| Co Recovery | % | 2.2 |
| Cr Recovery | % | 26.3 |
| Fe Recovery | % | 55.0 |
Source: SRK 2025
Table 1‑4: Economic Analysis Summary
| Item | Units | Value (C$) | Value (US$) |
| Payable Ni | Mlbs | 1,603 | 1,603 |
| Net Smelter Return | $/t-milled | 27.93 | 19.55 |
| Site Operating Costs | $/t-milled | 11.69 | 8.19 |
| Net C1 Costs | $/lb Ni-Eq | 6.22 | 4.36 |
| EBITDA | $/t-milled | 16.24 | 11.37 |
| Total Capital | $M | 4,805 | 3,363 |
| Initial Capital | $M | 3,317 | 2,322 |
| Sustaining Capital | $M | 1,487 | 1,041 |
| Net AISC | $/lb Ni-Eq | 6.96 | 4.87 |
| Pre-Tax NPV0% | $M | 8,830 | 6,181 |
| Pre-Tax NPV8% | $M | 1,917 | 1,342 |
| Post-Tax IRR | % | 15 | 15 |
| Post-Tax NPV0% | $M | 7,201 | 5,041 |
| Post-Tax NPV8% | $M | 1,480 | 1,036 |
| Post-Tax IRR | % | 14 | 14 |
| Payback (from Project Start) | Yrs | 9 | 9 |
| Payback (from Production) | Yrs | 6 | 6 |
Source: SRK 2025
The key assumptions used in the economic analysis are shown in Table 1‑5.
Table 1‑5: Economic Analysis Assumptions
| Assumption | Units | Value |
| Ni Price | US$/t | 20,000 |
| Co Price | US$/t | 40,000 |
| Fe Price | US$/dmt | 162 |
| Cr Price | US$/lb | 1.75 |
| Exchange Rate | US$:C$ | 0.70 |
| Fuel Price | C$/L | 1.20 |
| Electricity Cost | C$/kWh | 0.75 |
| Royalty | % | - |
Source: SRK 2025
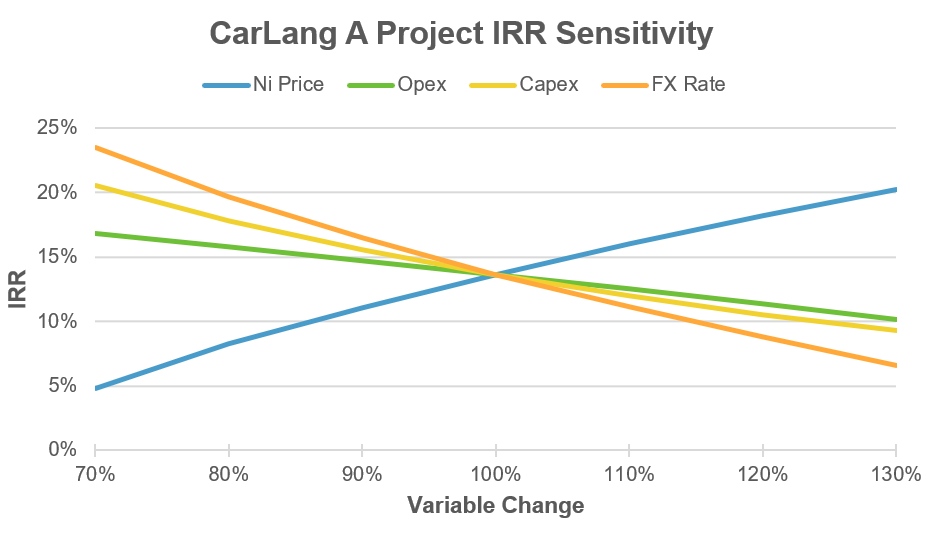
The key project economic indicators (NPV and IRR) are the most sensitive to exchange rate and metal prices, then capital expenditure, and the least sensitive to operating expenditure, see Figure 1‑1 and Figure 1‑2. The trends of the project sensitivity are generally in line with a typical greenfield mining project.
Figure 1‑1: CarLang A Project NPV8% Sensitivity
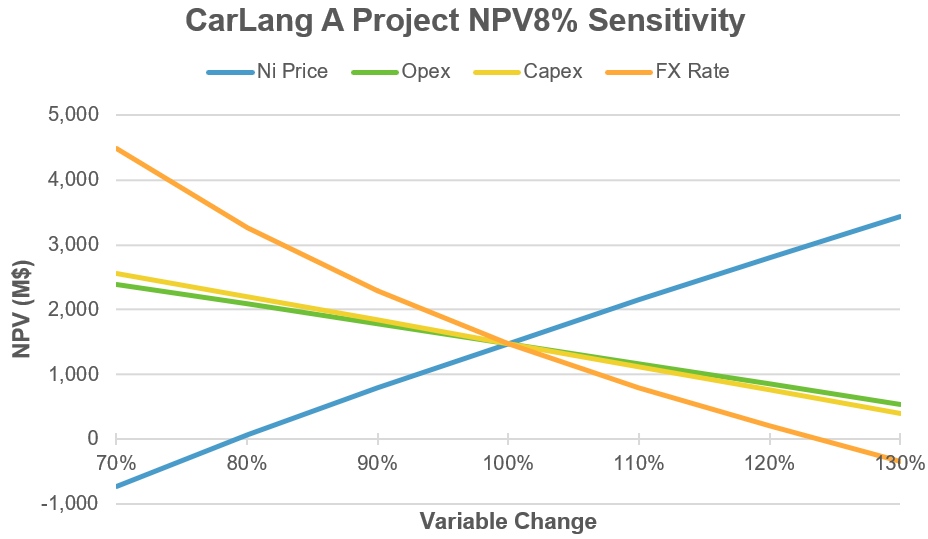
Figure 1‑2: CarLang A Project IRR Sensitivity
Mineral Resource Estimate
- The independent Qualified Person for the Mineral Resource Estimate, as defined by NI 43-101, is Mr. Simon Mortimer, (FAIG #4083) of Atticus Geoscience Consulting S.A.C., working with Caracle Creek International Consulting Inc. The effective date of the Mineral Resource Estimate is February 28, 2023.
- These Mineral Resources are not Mineral Reserves as they do not have demonstrated economic viability. The quantity and grade of reported Inferred Resources in this Mineral Resource Estimate are uncertain in nature and there has been insufficient exploration to define these Inferred Resources as Indicated. However, it is reasonably expected that the majority of Inferred Mineral Resources could be upgraded to Indicated Mineral Resources with continued exploration.
- The Mineral Resource Estimate was prepared following the CIM Estimation of Mineral Resources & Mineral Reserves Best Practice Guidelines (November 29, 2019).
- Mineralized domains were based on lithological contacts. A cut-off grade of 0.25% Ni was used for defining the high grade domain, which was determined on the basis of core assay geostatistics and drill core lithologies for the deposit.
- Geological and block models for the Mineral Resource Estimate used data from a total of 28 surface diamond drill holes (core). The drill hole database was validated prior to resource estimation and QA/QC checks were made using industry-standard control charts for blanks, core duplicates and commercial certified reference material inserted into assay batches by EV Nickel Inc.
- Estimates have been rounded to two significant figures.
- A cut-off grade of 0.12% NiEq was applied to the resource block model, calculated using the formula NiEq = Ni% + Co% x 2.09, which considers estimated recoveries of 55% for nickel and 40% for cobalt. Iron and sulphur were not considered in the calculation of NiEq. Iron was estimated to review its potential as a future by-product. Sulphur was estimated to be used in future metallurgical and mineralogical studies.
- The mineral resource estimates have been constrained by conceptual pit envelopes using the following optimization parameters, as provided by EV Nickel Inc. and agreed to by the QP. Metal prices used were (US$) $8.00/lb nickel and $23.00/lb cobalt. An overall pit slope of 45 degrees was used. Mining and processing costs (US$) were based on benchmarking from similar deposit types in the area, utilizing a mining cost of $3.50/t, a processing cost of $4.50/t, a G&A cost of $2.50/t, and a selling cost of $0.80/lb.
- The geological model comprises two mineralized domains hosted by variably serpentinized ultramafic rocks: a relatively higher-grade core (largely dunite) and a lower grade envelope (combination of dunite and peridotite). Individual wireframes were created for each domain.
- The block model was prepared using Micromine 2020. A 20 m x 20 m x 15 m block model was created and samples were composited at 7.5 m intervals. Grade estimation from drill hole data was carried out for Ni, Co, Fe, and S using Ordinary Kriging (Ni, Co) and Dual Kriging (Fe, S) interpolation methods.
- Grade estimation was validated by comparison of input and output statistics (Nearest Neighbour and Inverse Interpolation methods), swath plot analysis, and by visual inspection of the assay data, block model, and grade shells in cross-sections.
- Density estimation was carried out for the mineralized domains using the Ordinary Kriging interpolation method, on the basis of 940 specific gravity measurements collected during the core logging process, using the same block model parameters of the grade estimation. As a reference, the average estimated density value within the higher-grade is 2.68 g/cm3 (t/m3), while the lower-grade domain of the resource model yielded 2.77 g/cm3 (t/m3).
A Technical Report in support of the PEA has been filed on SEDAR (www.sedar.com) with an effective as of May 5, 2025.
Large Scale Track- CarLang A
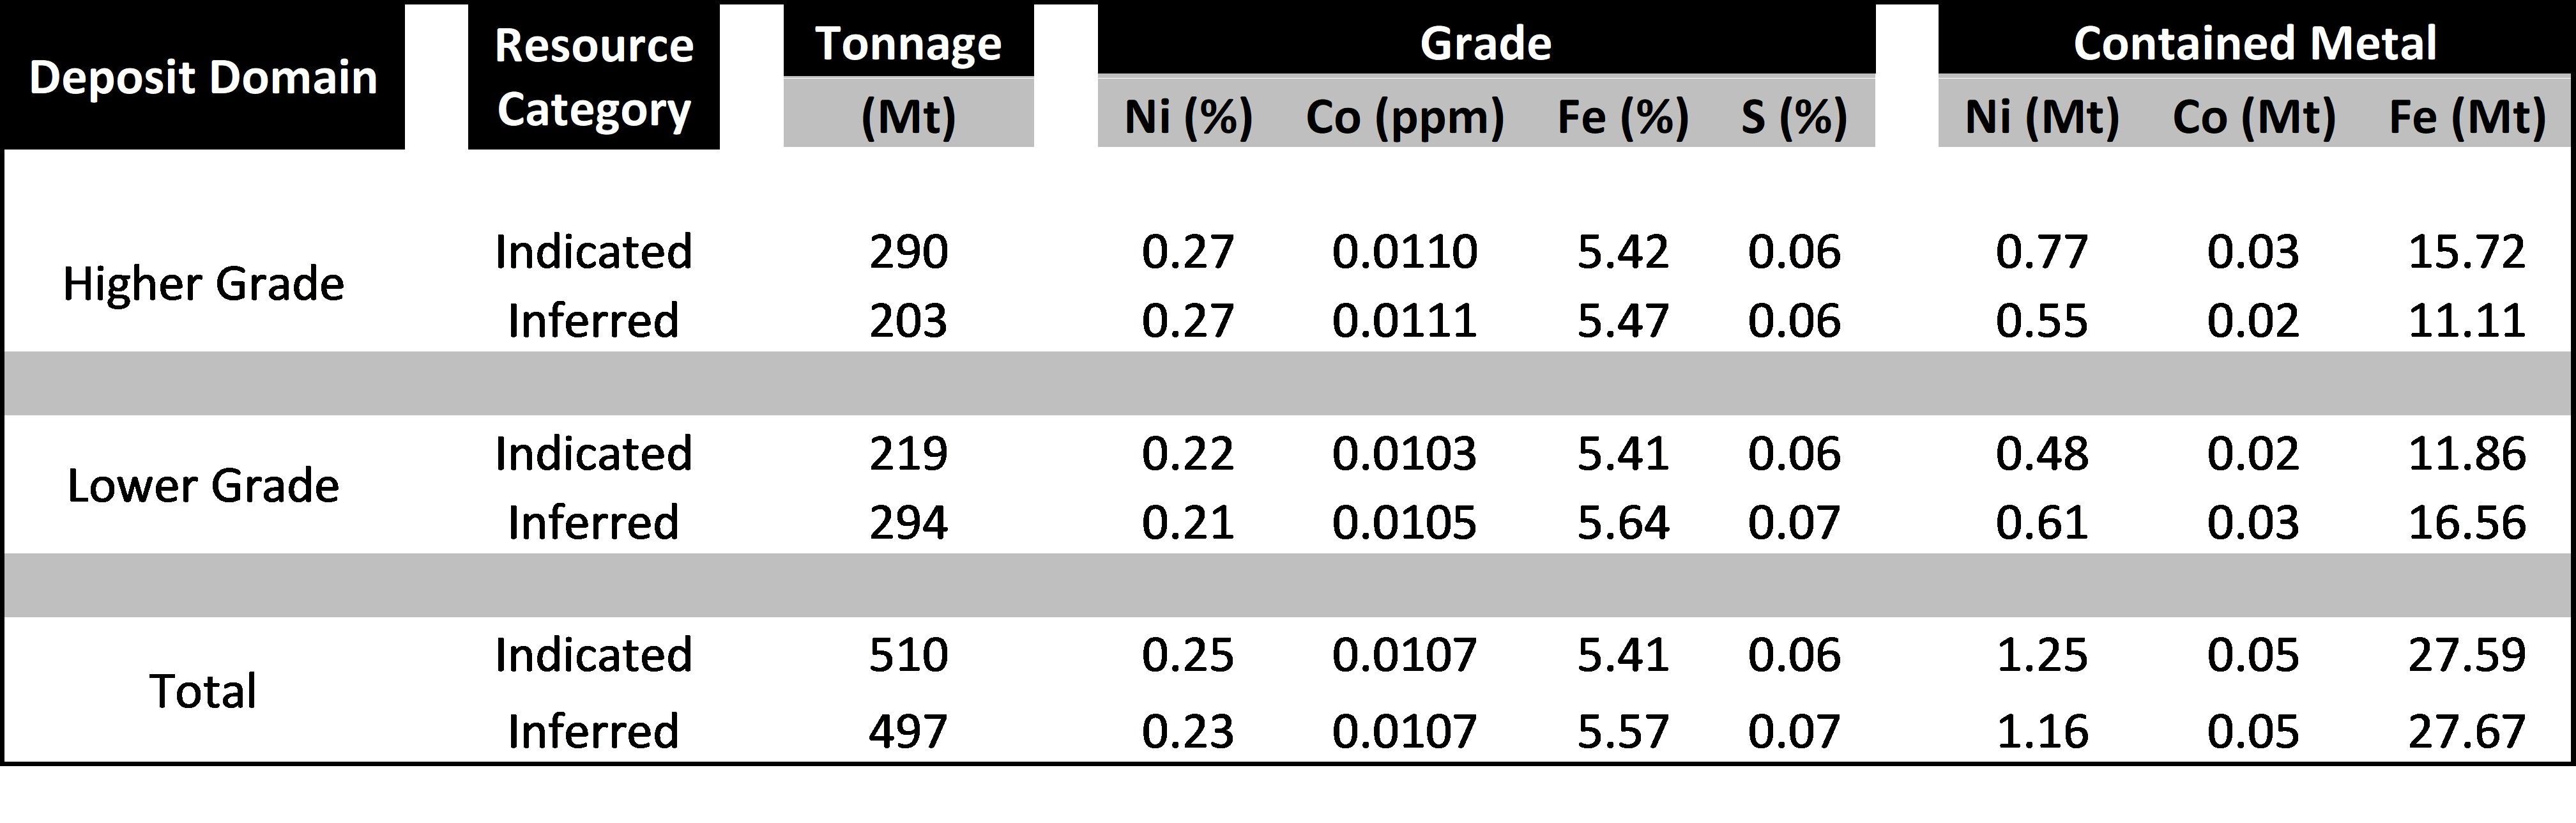
After acquiring the Property in April 2022 (see News Release dated April 4, 2022), EVNi launched a diamond drilling program (28 holes totalling 8,295 m) to complete a maiden mineral resource estimate in accordance with National Instrument 43-101 (“NI 43-101”) which shows Indicated Resources of 1.25M tonnes or 2.8B pounds of contained nickel and Inferred Resources of 1.16M tonnes or 2.6B pounds of contained nickel.

- The independent Qualified Person for the Mineral Resource Estimate, as defined by NI 43-101, is Mr. Simon Mortimer, (FAIG #4083) of Atticus Geoscience Consulting S.A.C., working with Caracle Creek International Consulting Inc. The effective date of the Mineral Resource Estimate is February 28, 2023.
- These Mineral Resources are not Mineral Reserves as they do not have demonstrated economic viability. The quantity and grade of reported Inferred Resources in this Mineral Resource Estimate are uncertain in nature and there has been insufficient exploration to define these Inferred Resources as Indicated. However, it is reasonably expected that the majority of Inferred Mineral Resources could be upgraded to Indicated Mineral Resources with continued exploration.
- The Mineral Resource Estimate was prepared following the CIM Estimation of Mineral Resources & Mineral Reserves Best Practice Guidelines (November 29, 2019).
- Mineralized domains were based on lithological contacts. A cut-off grade of 0.25% Ni was used for defining the high grade domain, which was determined on the basis of core assay geostatistics and drill core lithologies for the deposit.
- Geological and block models for the Mineral Resource Estimate used data from a total of 28 surface diamond drill holes (core). The drill hole database was validated prior to resource estimation and QA/QC checks were made using industry-standard control charts for blanks, core duplicates and commercial certified reference material inserted into assay batches by EV Nickel Inc.
- Estimates have been rounded to two significant figures.
- A cut-off grade of 0.12% NiEq was applied to the resource block model, calculated using the formula NiEq = Ni% + Co% x 2.09, which considers estimated recoveries of 55% for nickel and 40% for cobalt. Iron and sulphur were not considered in the calculation of NiEq. Iron was estimated to review its potential as a future by-product. Sulphur was estimated to be used in future metallurgical and mineralogical studies.
- The mineral resource estimates have been constrained by conceptual pit envelopes using the following optimization parameters, as provided by EV Nickel Inc. and agreed to by the QP. Metal prices used were (US$) $8.00/lb nickel and $23.00/lb cobalt. An overall pit slope of 45 degrees was used. Mining and processing costs (US$) were based on benchmarking from similar deposit types in the area, utilizing a mining cost of $3.50/t, a processing cost of $4.50/t, a G&A cost of $2.50/t, and a selling cost of $0.80/lb.
- The geological model comprises two mineralized domains hosted by variably serpentinized ultramafic rocks: a relatively higher-grade core (largely dunite) and a lower grade envelope (combination of dunite and peridotite). Individual wireframes were created for each domain.
- The block model was prepared using Micromine 2020. A 20 m x 20 m x 15 m block model was created and samples were composited at 7.5 m intervals. Grade estimation from drill hole data was carried out for Ni, Co, Fe, and S using Ordinary Kriging (Ni, Co) and Dual Kriging (Fe, S) interpolation methods.
- Grade estimation was validated by comparison of input and output statistics (Nearest Neighbour and Inverse Interpolation methods), swath plot analysis, and by visual inspection of the assay data, block model, and grade shells in cross-sections.
- Density estimation was carried out for the mineralized domains using the Ordinary Kriging interpolation method, on the basis of 940 specific gravity measurements collected during the core logging process, using the same block model parameters of the grade estimation. As a reference, the average estimated density value within the higher-grade is 2.68 g/cm3 (t/m3), while the lower-grade domain of the resource model yielded 2.77 g/cm3 (t/m3).
A Technical Report in support of the MRE has been filed on SEDAR (www.sedar.com) with an effective as of February 28, 2023.